
HOME SERVICE KPI DASHBOARD

See where the month stands while you can still fix it

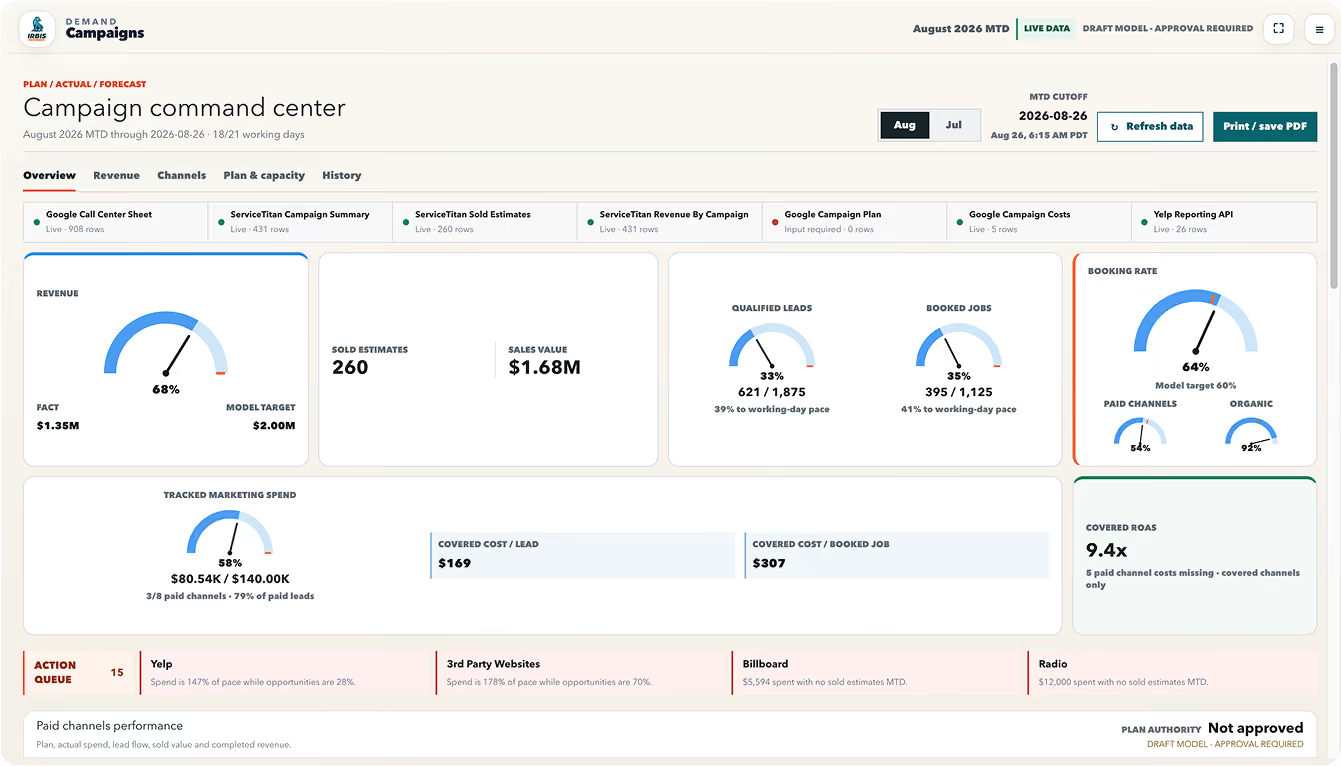
Company targets, per-technician numbers, and channel performance in one place, updating while the month is still open. Not a report you read after it is too late to act on it.

Dashboard
Calm, misty body of water with a soft gradient sky above.
WHY THIS EXISTS

Most Owners Find Out the Month Went Badly in the Second Week of the Next One

By then, the crew is already halfway through another one. A goal only works if you can see the gap while there is still time to close it. 

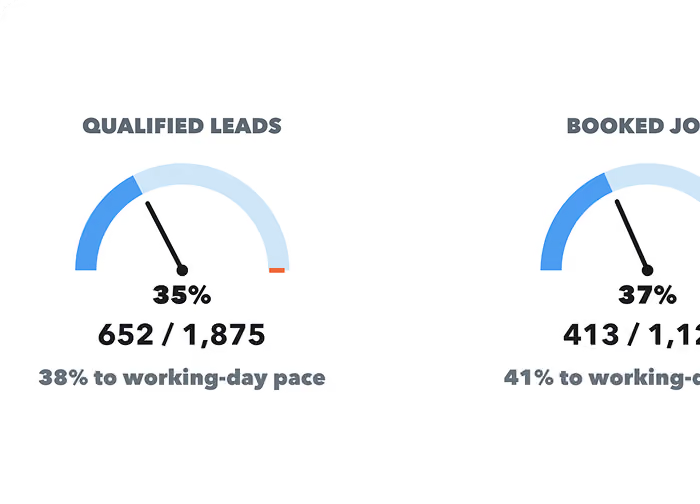
It also paces against working days, not calendar days. Six working days into a twenty-two-day month, sitting at a quarter of target is ahead, not behind. Most reporting cannot tell the difference, which is why owners panic in the first week for no reason and then relax in the third when they should not.

This is the dashboard IRBIS runs on.

WHAT YOU TRACK

The home service KPIs that decide
the month
, in one place

Most agencies run the ads and leave the rest to you

Company goals

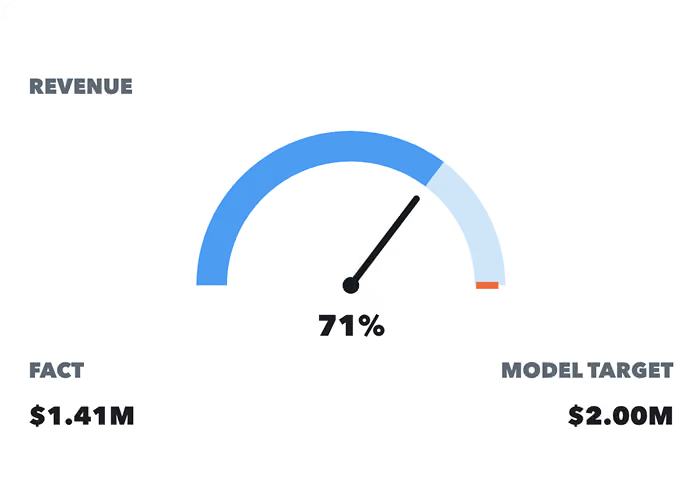
Revenue, booked jobs, average ticket, and close rate against the target you set for the month, not against last year's vague sense of how things went.

Technician performance tracking

Revenue per technician, average ticket and conversion, tech by tech. Who is carrying the month, who needs coaching, and whose productivity has been sliding for two months while nobody noticed.

Marketing performance

Spend, leads, cost per lead, and cost per booked job by channel, commissions included. The number that tells you whether to add budget or pull it.

WHAT IT TELLS YOU

It tells you what needs attention, not just what the numbers are

A dashboard that only shows numbers still leaves you to work out what they mean. This one keeps a running list of what needs attention, written in plain words.

Examples:

A channel spending money with nothing sold yet this month
A booking rate sitting under the target you set
Leads arriving with no channel assigned, so the spend cannot be traced
A cost feed that stopped reporting, so the numbers above it are incomplete
You open it, read the list, and know what today's decision is.
WHERE THE DATA COMES FROM

It reads your ServiceTitan data instead of a spreadsheet

Connects to ServiceTitan, Housecall Pro, your call center, and the ad platforms you spend on, including Yelp, Google Local Services, and Meta. Nobody copies numbers into a spreadsheet on Friday afternoon, and ServiceTitan reporting stops being a separate job.

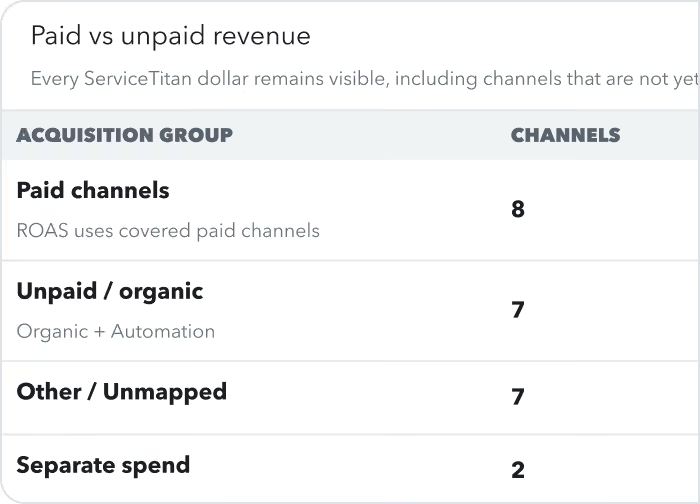
And when a cost feed is not connected, the dashboard says so. You will see which channels are covered and which are not, instead of a confident return-on-spend figure built on half the spend.

A number you cannot trust is worse than no number at all. Most reporting tools will not tell you that.

THE NUMBER MOST OWNERS DO NOT WATCH

What Should Revenue per Technician Be?

There is no single benchmark, because it moves with your trade, your average ticket, and your market. But the direction matters more than the number.

At IRBIS it went from $200K to $333K per technician over six years, while headcount grew from five to sixty. Revenue growth from hiring is arithmetic. Revenue growth per person is a system.

It is also the first number we look at when an owner tells us the company is busy but not making money. The dashboard tracks it per technician, per month, against the target you set.

HOW IT WORKS

Setup in Three Steps

Blue briefcase icon with handle and clasp, representing business or work.

Set your targets

Monthly targets for the company, each technician, and each marketing channel.

Blue gear icon representing settings or configuration.

Connect your data

Your CRM, call center, and ad accounts feed the dashboard directly.

Blue stylized icon of a three-section office building with multiple windows and a central entrance.

Track and adjust

Month-to-date pacing against every target, so you can move budget or coach a technician while the month is still open.

FAQ

Questions Owners Ask

Does it work with ServiceTitan?

Yes. ServiceTitan is the system it was built around because that is what IRBIS runs on. Revenue, sold estimates, and job data come across directly.

Who enters the data?

Nobody, for the connected sources. Targets are set once a month, and anything the dashboard cannot reach is flagged instead of leaving it blank.

What happens to my data if I stop using it?

It is returned or deleted at your request. Your CRM and ad accounts stay untouched, and we remove our access.

SEE IT ON YOUR NUMBERS

Book a Demo

Twenty minutes. We will walk through the dashboard with your trade and your team size in mind, and you can decide whether it is worth setting up.
Want to look around first? Open the live dashboard.

By submitting this form, you agree to our Privacy Policy and consent to being contacted regarding your inquiry.

Thank you! Your submission has been received!
Oops! Something went wrong while submitting the form.
We will follow up within one business day.
Calm, misty body of water with a soft gradient sky above.